Tips for generating statistical reports
Use these guides to generate basic statistical reports to help you identify the effectiveness of your campaigns.
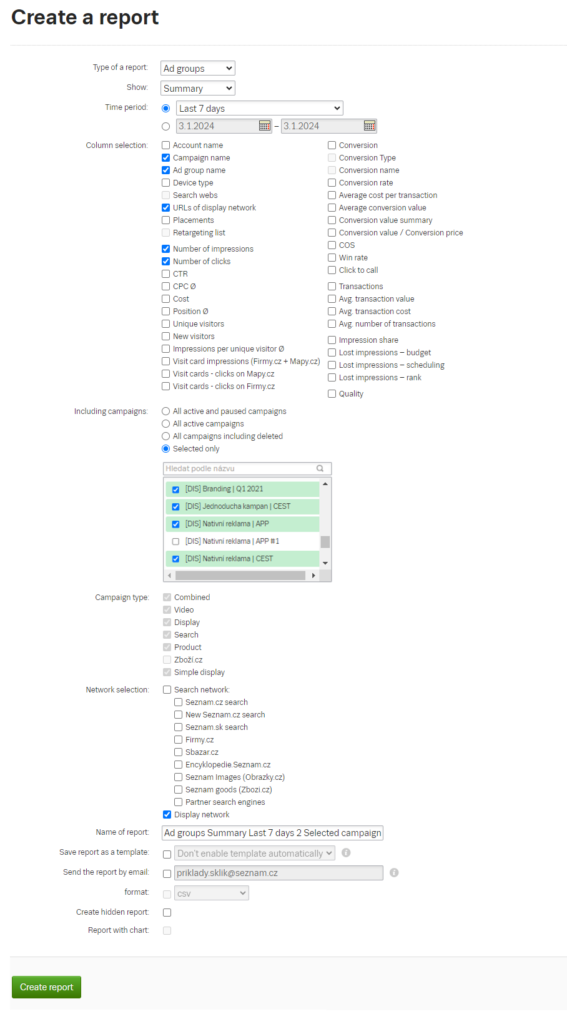
In the static reports, select the options as shown in the picture below. It is important to have the URLs checked and statistics generation selected for the Display network only. The other items are optional and it’s entirely up to you what values you want to see in the static report for your chosen campaigns and for what time period.
Once generated, you can see in detail which specific URLs your ad was displayed on, and you can evaluate the performance.

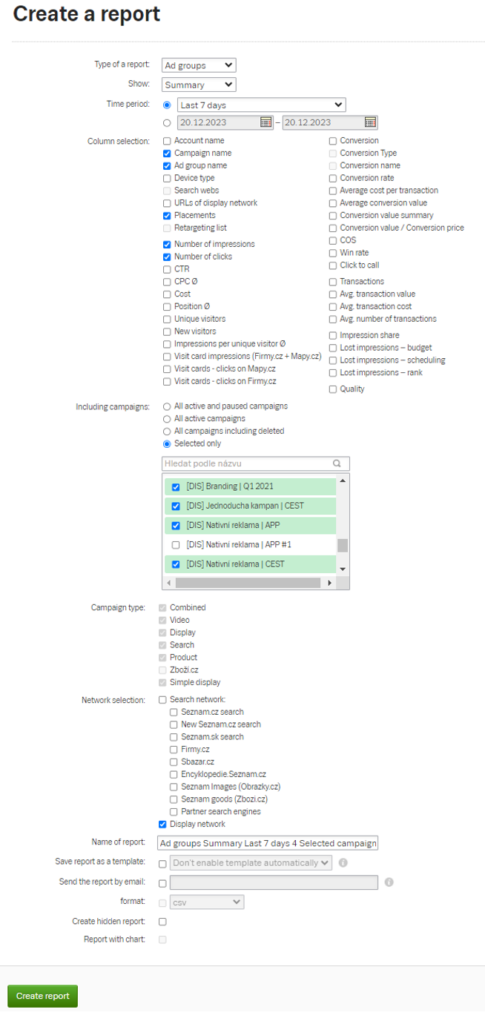
In the static reports, select the options as shown in the picture below. It is important to have the Placements checked and statistics generation selected for the Display network only. The other items are optional and it’s entirely up to you what values you want to see in the static report for your chosen campaigns and for what time period.
In this statistical report, you will see the web pages where your ads from the selected campaigns/ad groups were displayed and the metrics you selected in the previous step.
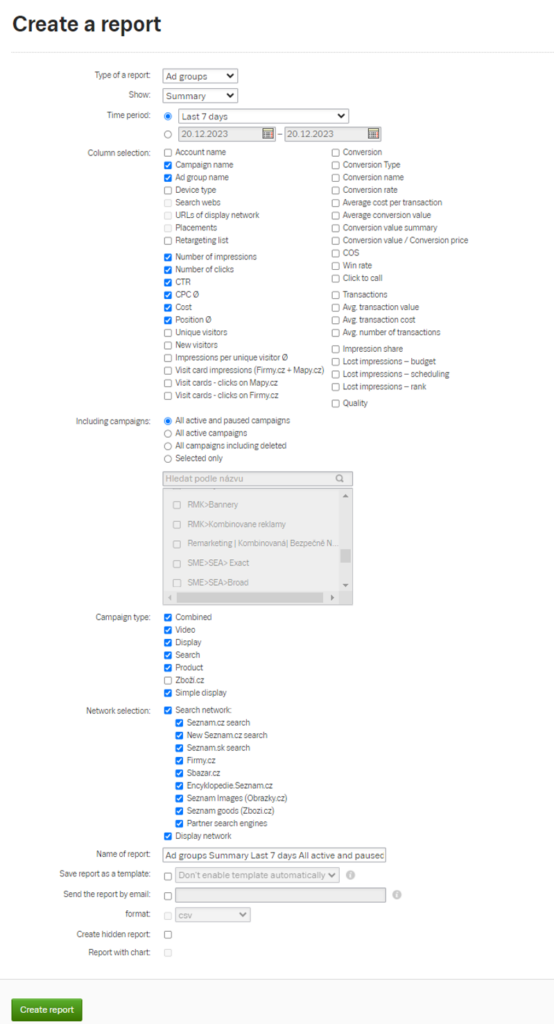
You can use the statistical reports to generate any metrics you wish for the chosen period. Select the options as shown in the picture below to generate basic metrics related to the performance of your campaigns with a breakdown for each ad group.
If you select the columns as in the image above, you will generate a report that contains the basic performance metrics of your selected campaigns such as Impressions, Clicks, CTR, CPC Ø, Cost and Position Ø.
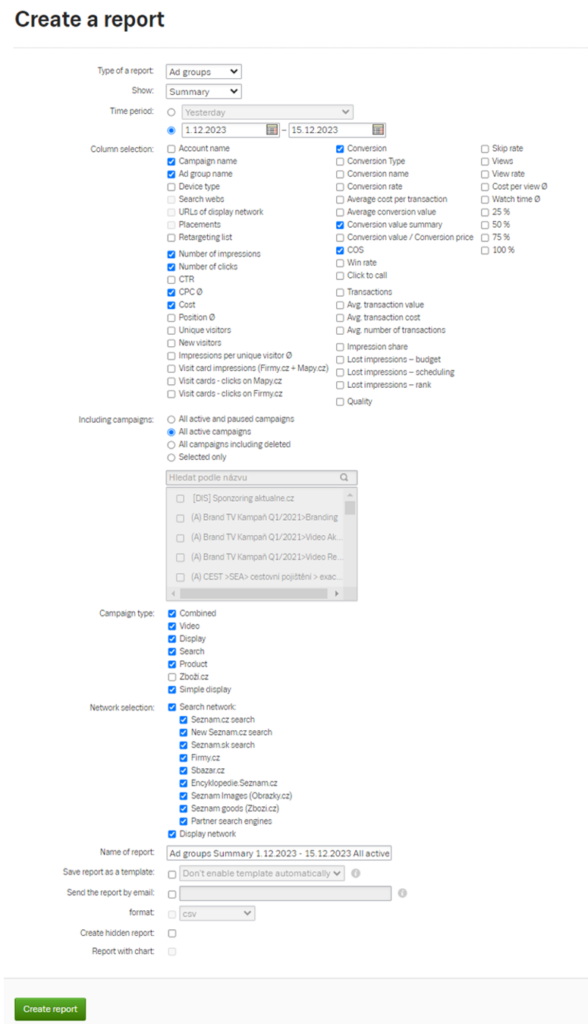
You can generate an overview of conversions or their value for any period using the statistical report. In this report you will see how many conversions your Sklik ads have delivered. Again, it is up to you which campaigns and for which time period you want to include in the statistical report.
In the final report, you can then see how your selected campaigns performed, how many impressions they had, the number of clicks and the number of conversions those clicks brought. Finally, you can see what the “Cost of Sales Ratio” was, i.e. the ratio of cost (the cost of all clicks) to sales (the total value of all conversions).
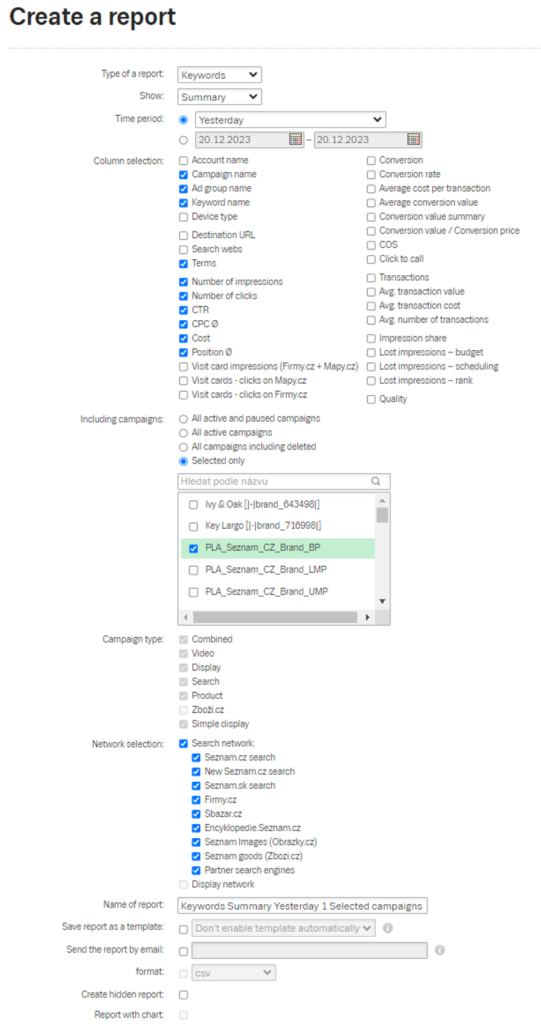
In the static reports, select the options as shown below. To generate a statistical report with search queries at the keyword level, it is important to check “Terms” in the Keywords report type and Summary view. The other items are optional and it’s entirely up to you what values you wish to display in the static report for your chosen campaigns and over what time period.
If you select columns like the one shown above, you’ll generate a report that includes the search query associated with a specific keyword and the basic performance metrics of your chosen campaigns. Once generated, you can review and evaluate in detail what search queries your ads were displayed for and what their performance was.
